Building your own portfolio tracker
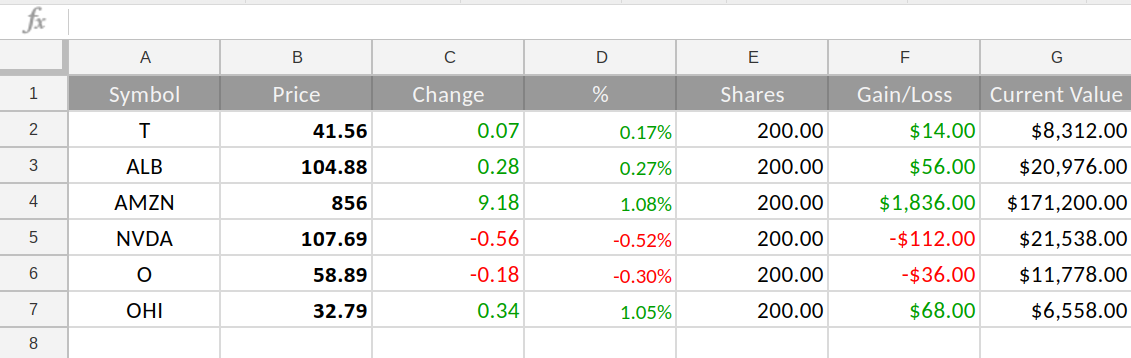
The following is a simple guide on how to build a portfolio tracker, similar to the one pictured below, using Google Sheets.
Create the Header
Enter the labels for your headers.- Cell A1 - Symbol
- Cell B1 - Price
- Cell C1 - Change
- Cell D1 - %
- Cell E1 - Shares
- Cell F1 - Gain/Loss
- Cell G1 - Current Value
Enter your stocks
Next step is to enter the stocks you own and the formulas that will fetch quotes as they change.Repeat the process for every stock. You may optionally cut the first row and paste the information into subsequent rows, then edit the values for ticker (A2) and number of shares (E2). All the other cells do not need to be edited.- Cell A2 - Enter the stock Ticker Symbol
- Cell B2 - =GOOGLEFINANCE(A2,"price")
- Cell C2 - =GOOGLEFINANCE($A2,"change")
- Cell D2 - =GOOGLEFINANCE($A3,"changepct")/100
- Cell E2 - Enter the number of shares
- Cell F2 - =C3*E3
- Cell G2 - =B3*E3
Conclusion
With the above steps, you now have a basic functioning stock portfolio that is updated as prices change throughout the day. The functionality can be expanded by adding more columns such as purchasing price, date etc. With these additions, you can track such things as portfolio performance over time.
We will be building on this over several articles, so check back occassionally. You will notice that the picture above shows gains in green, and a loss in red. The version we just built shows everything in black. Our next article will be on how to implement conditional formating to apply colors.
Over time, we will add a realtime lookup that gets current price, opening price, closing price from previous day and volume. We will also explore getting dividend and yield for dividend paying stocks.